Tableau – it’s one of the most popular data visualisation tools on the market. If you haven’t heard of it, data analysts around the world love it. It gives analysts the ability to present data in ways that people (regardless of their ability with data) can understand.
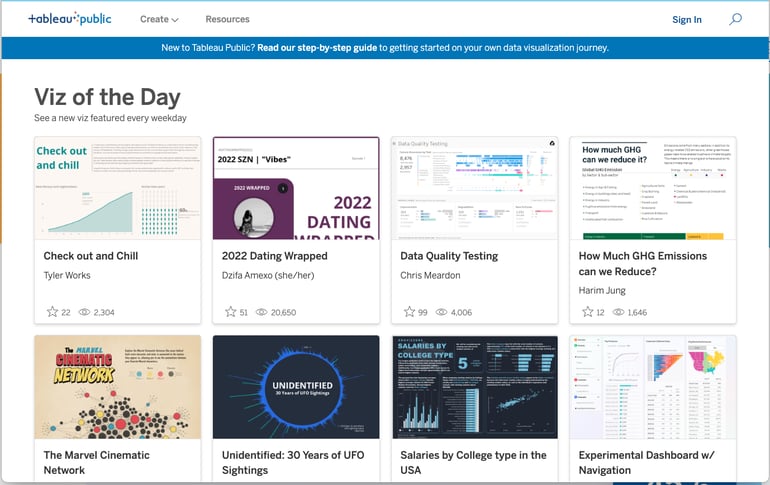
Don't believe me? Check out this free resource, Vis of the Day, where Tableau wizards publish their data triumphs. Only the best are selected and it is almost like a wall of fame among the data community.

Who knew you could make data about milk consumption in the USA so beautiful and insightful! One of my personal favourites, as a football fan, is Football Storm by Alexander Varlamov. Viz of the Day is bookmarked for me and I turn to it whenever I need to get the creative juices flowing.
Found this Little Missions interesting?
Subscribe to get Little Missions delivered straight to your inbox.


